In today’s fast-paced fashion industry, strategic sourcing can make or break a business. The selection of the country and supplier responsible for producing your company’s products can impact multiple key performance indicators including margin, speed to market, returns rate, brand reputation, and the availability of products. The decision on where to source from holds significant importance.
With so many variables at play, it can be difficult to know where to start. That’s why more and more fashion companies are turning to data and analytics to guide their sourcing decisions and take their businesses to the next level.
What types of data and analytics can be used in fashion strategic sourcing?
Several types of data can be used in fashion strategic sourcing, including global export/import data, country market share, benchmark pricing, supplier performance and credentials, sustainability and market trend analysis.
Import/Export Data
Import data can be helpful to understand the key countries exporting certain products and analyse whether their production is increasing or decreasing. This information helps buying or procurement teams determine whether there are new and relevant market opportunities.
Let’s take an example:
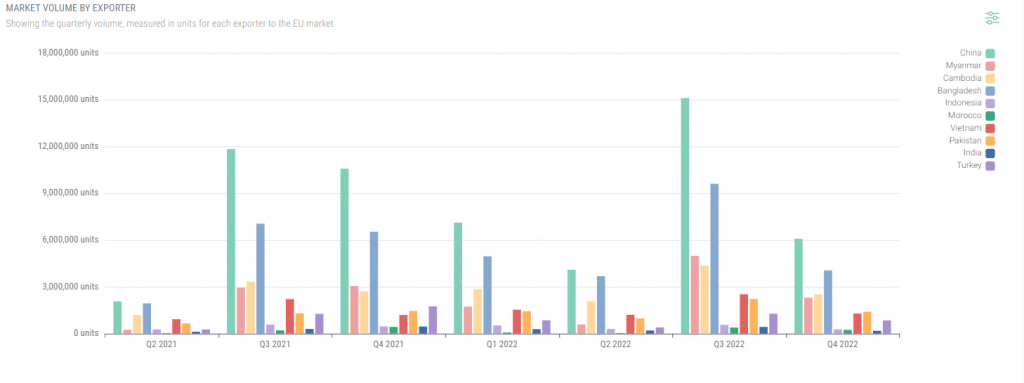
The Imports of Apparel into the EU
The graph seen below displays the influx of apparel imported to the European Union from the top ten importing countries, based on units. We see that China across a two year period has the highest number of units of apparel imported into the EU, closely followed by Bangladesh.
This information shows that despite retailers’ efforts to find alternative sources of production away from China, China still remains a top country for apparel due to capacity and competitiveness.
Another way of looking at import/export data is to look at countries’ product market share. By using this metric, sourcing teams are able to see spikes in growth for specific countries.
Here is another example:
Apparel Imports by Country
The following graph illustrates the market share of apparel imports by country to the EU and how this compares against different markets.
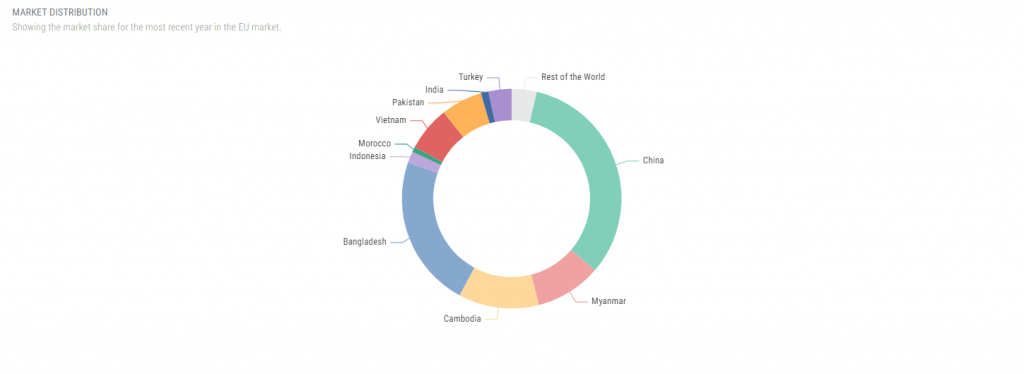
Analysing this data over a certain period of time would produce trends showing if and which countries are seeing changes in production (growth or loss).
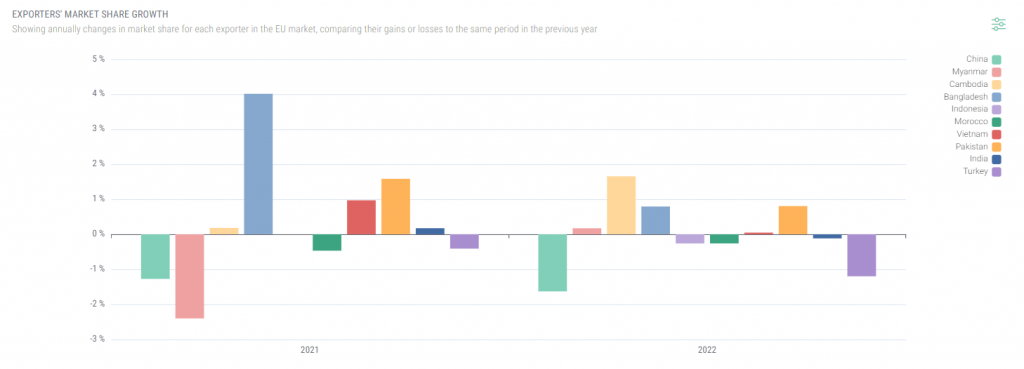
Tracking Country Market Share Growth
The chart displayed below demonstrates the changes in market share growth for the top ten countries in apparel imports to the EU. Making informed decisions is vital when sourcing and interpreting these data shifts can provide necessary information.
For instance, in the graph below, we see that Bangladesh increased its market share in both 2021 (+ 4%) and 2022 (+1%). This suggests that the country is on the rise, and likely to be a safe bet moving forward.
This is the opposite case for China, which saw two consecutive losses of market share. This may indicate that the country is losing competitiveness or EU buyers are looking for alternatives to minimise risks. More recently, the rise of imports from Cambodia is worth considering further for brands, possibly indicating positive competitiveness from the country.
Benchmark Pricing
Using pricing data enables sourcing teams to compare price ranges for specific products in different countries, providing valuable insight into competitive markets that are commercially viable.
Through pricing intelligence, sourcing teams can determine if they are receiving the most advantageous prices for their products or if there could be other commercially viable markets to explore.
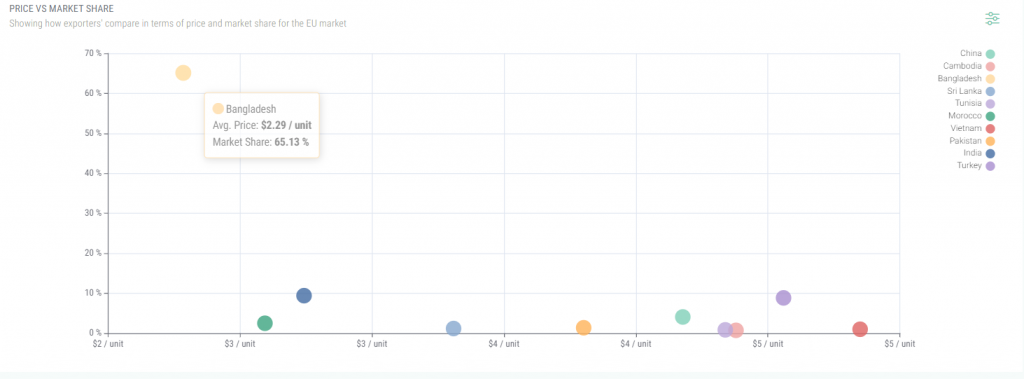
Analysing Pricing and Market Share
Examining the correlation between pricing and market share can provide valuable sourcing insights for fashion brands. The graph displayed below charts the average unit price points of certain countries and their import share into the EU.
Based on the chart, Bangladesh has the lowest pricing and boasts the largest market share of 65%, indicating a likely tie between these factors.
India is also an interesting contender, with slightly highest pricing and lower market share. This can be used as an indicator to source from the country for competitive sourcing from a less in-demand market.
How can data and analytics help in identifying reliable suppliers in the fashion industry?
Data and analytics can assist in identifying dependable suppliers in the fashion industry by providing critical information about their performance, customer lists, production history, sustainability, certification, and quality standards.
Through the use of sophisticated analytics tools, like machine learning and predictive modelling, fashion companies can analyse vast quantities of data to identify patterns and trends that reveal the most reliable suppliers that are most suitable to their business needs.
Furthermore, data and analytics can help fashion businesses monitor suppliers’ performance over time, ensuring that they continue to meet their expectations and deliver high-quality products on time and within budget.
To access Sourcing Playground’s analytics you can sign up for a free trial below.